Implementation of Prometheus and Grafana for kbt_microservices
2. SSH access to EC2
SSH into EC2 instance named ECSInstance-kbt-merco-services using Gitbash with following command,
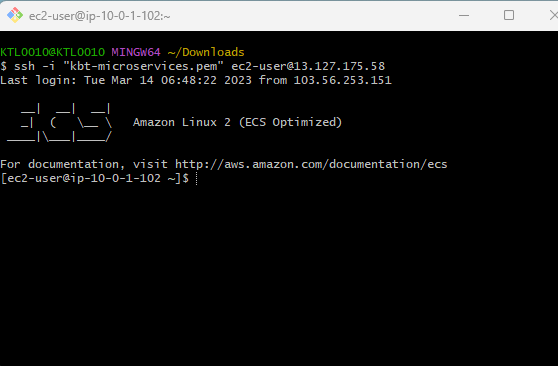
Figure 1. Login to EC2
3. prometheus.yml
Create a file named prometheus.yml configuration file , where our targets are specified to scrape the metrics .
3.2. Job for alertmanager
rule_files:
  - 'prometheus_rules.yml'
alerting:
  alertmanagers:
  - static_configs:
    - targets:
      - '13.127.175.58:9093'
3.3. Job to scrape prometheus metrics
        scrape_configs:
          - job_name: 'prometheus'
            static_configs:
- targets: ['localhost:9090']4. Run prometheus as a docker image for scraping metrics from the application using the command ,
sudo docker run -d --name prometheus -p 9090:9090 -v /home/ec2-user/prometheus.yml:/etc/prometheus/prometheus.yml prom/prometheus
5. In the Security group of EC2 allow port:9090, where the prometheus is running.
Prometheus metrics will be visible on http://{IP_address}:9090/
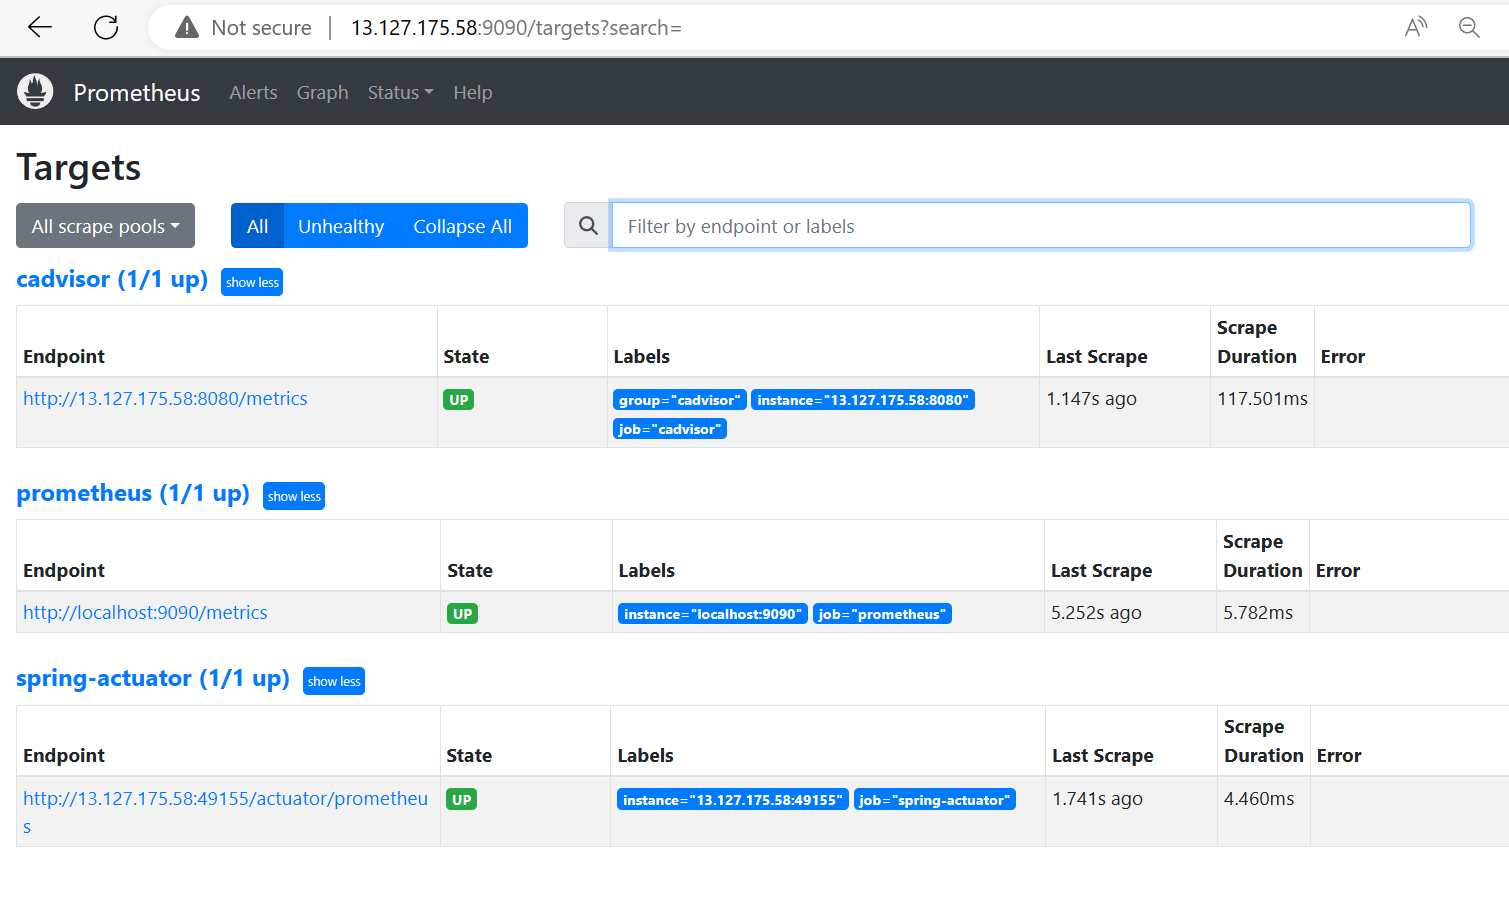
Figure 2. Prometheus targets
6. As our microservices is deployed as a docker container, Run CAdvisor as a docker image for scraping the container metrics.
sudo docker run --volume=/:/rootfs:ro --volume=/var/run:/var/run:ro --volume=/sys:/sys:ro --volume=/var/lib/docker/:/var/lib/docker:ro --volume=/dev/disk/:/dev/disk:ro --publish=8080:8080 --detach=true --name=cadvisor gcr.io/google-containers/cadvisor:latest
7. In the Security group of EC2 allow port:8080, where the CAdvisor is running.
CAdvisor metrics will be visible on http://{IP_address}:8080/
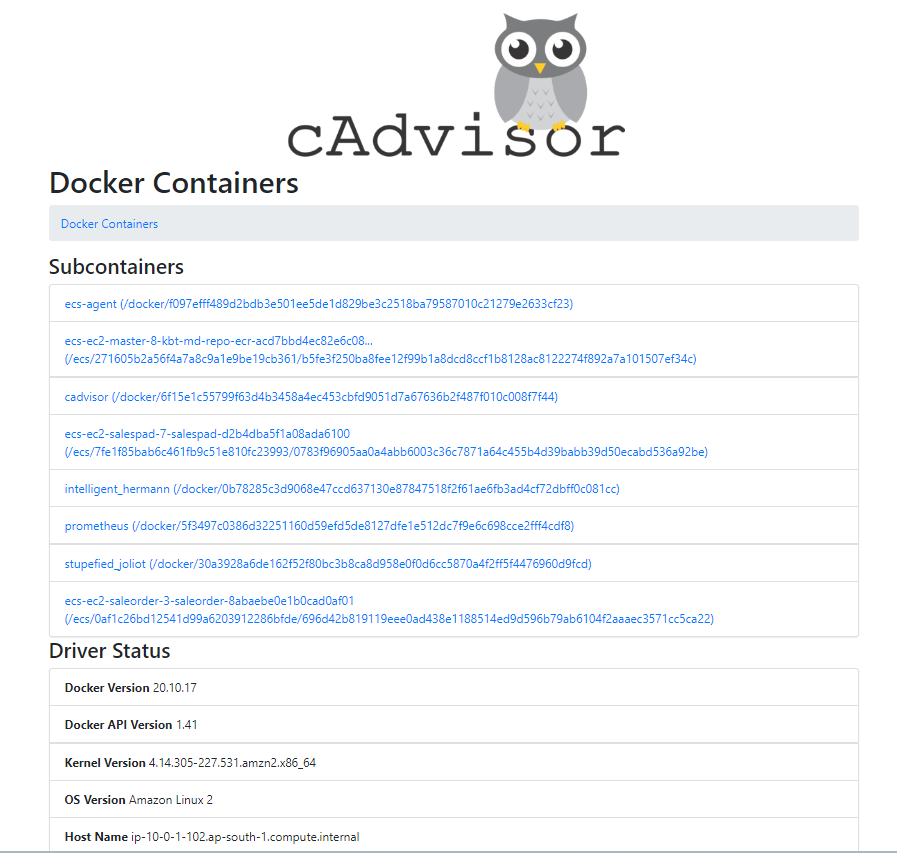
Figure 3. CAdvisor
8. To monitor the Springboot application , Add two dependencies named springboot-actuator and micrometer to the pom.xml for scraping the metrics.
<dependency>
    <groupId>org.springframework.boot</groupId>
    <artifactId>spring-boot-starter-actuator</artifactId>
</dependency>
<dependency>
    <groupId>io.micrometer</groupId>
    <artifactId>micrometer-core</artifactId>
</dependency>
<dependency>
    <groupId>io.micrometer</groupId>
    <artifactId>micrometer-registry-prometheus</artifactId>
</dependency>
<dependency>
    <groupId>org.hibernate</groupId>
    <artifactId>hibernate-micrometer</artifactId>
    <version>5.6.1.Final</version>
</dependency>
9. Configure application.properties for prometheus scraping.
application.properies
management.endpoints.web.exposure.include=*
metrics.tags.application=Ms_Md_Master
management.port=9000
10. Added this code to the main class of springboot Application
Folder path : ms_md_master -> src -> main -> java/com/kb/merco/ms_md_master -> MsMdMasterApplication.java
Added code for considering all paths
@Bean
public WebMvcEndpointHandlerMapping webEndpointServletHandlerMapping(WebEndpointsSupplierwebEndpointsSupplier,ServletEndpointsSupplier servletEndpointsSupplier, ControllerEndpointsSupplier controllerEndpointsSupplier,EndpointMediaTypes endpointMediaTypes, CorsEndpointProperties corsProperties, WebEndpointProperties webEndpointProperties, Environment environment)
{
		List<ExposableEndpoint<?>> allEndpoints = new ArrayList<>();
		Collection<ExposableWebEndpoint> webEndpoints = webEndpointsSupplier.getEndpoints();
		allEndpoints.addAll(webEndpoints);
		allEndpoints.addAll(servletEndpointsSupplier.getEndpoints());
		allEndpoints.addAll(controllerEndpointsSupplier.getEndpoints());
		String basePath = webEndpointProperties.getBasePath();
		EndpointMapping endpointMapping = new EndpointMapping(basePath);
		boolean shouldRegisterLinksMapping = this.shouldRegisterLinksMapping(webEndpointProperties, environment,
				basePath);
		return new WebMvcEndpointHandlerMapping(endpointMapping, webEndpoints, endpointMediaTypes,
				corsProperties.toCorsConfiguration(), new EndpointLinksResolver(allEndpoints, basePath),
				shouldRegisterLinksMapping, null);
	}

	private boolean shouldRegisterLinksMapping(WebEndpointProperties webEndpointProperties, Environment environment,
											   String basePath)
    {
		return webEndpointProperties.getDiscovery().isEnabled() && (StringUtils.hasText(basePath)
				|| ManagementPortType.get(environment).equals(ManagementPortType.DIFFERENT));
	}
Springboot metrics will be visible on http://13.127.175.58:49155/actuator/prometheus
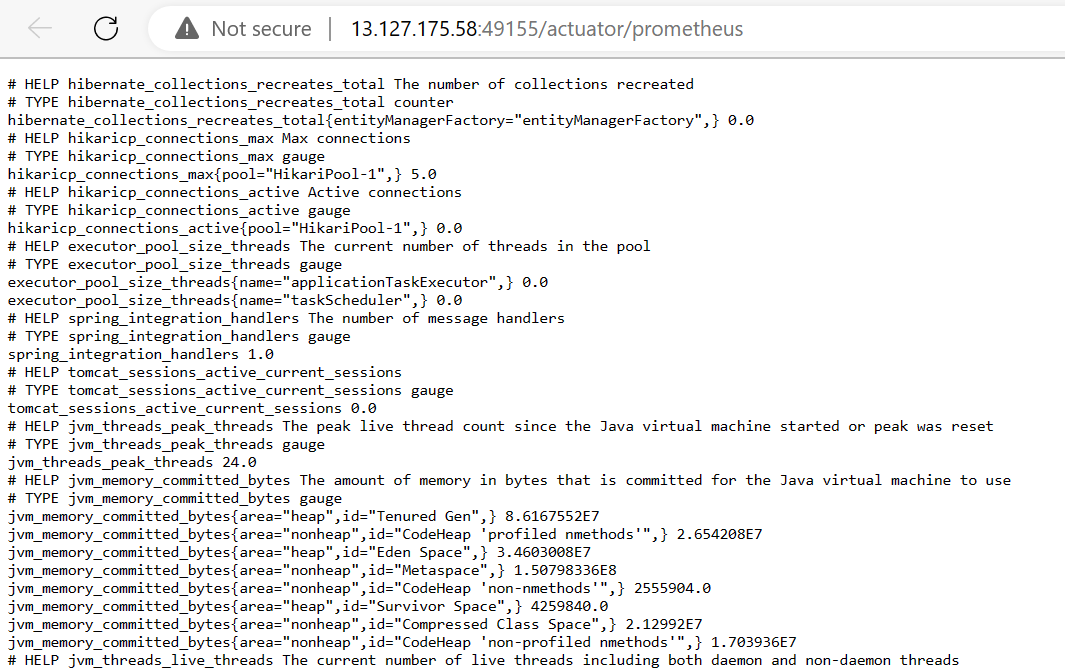
Figure 4. springboot-actuator-metrics
11. For visualizing the metrics,allow port:3000 on EC2 instance security group
sudo docker run --name grafana -d -p 3000:3000 grafana/grafana
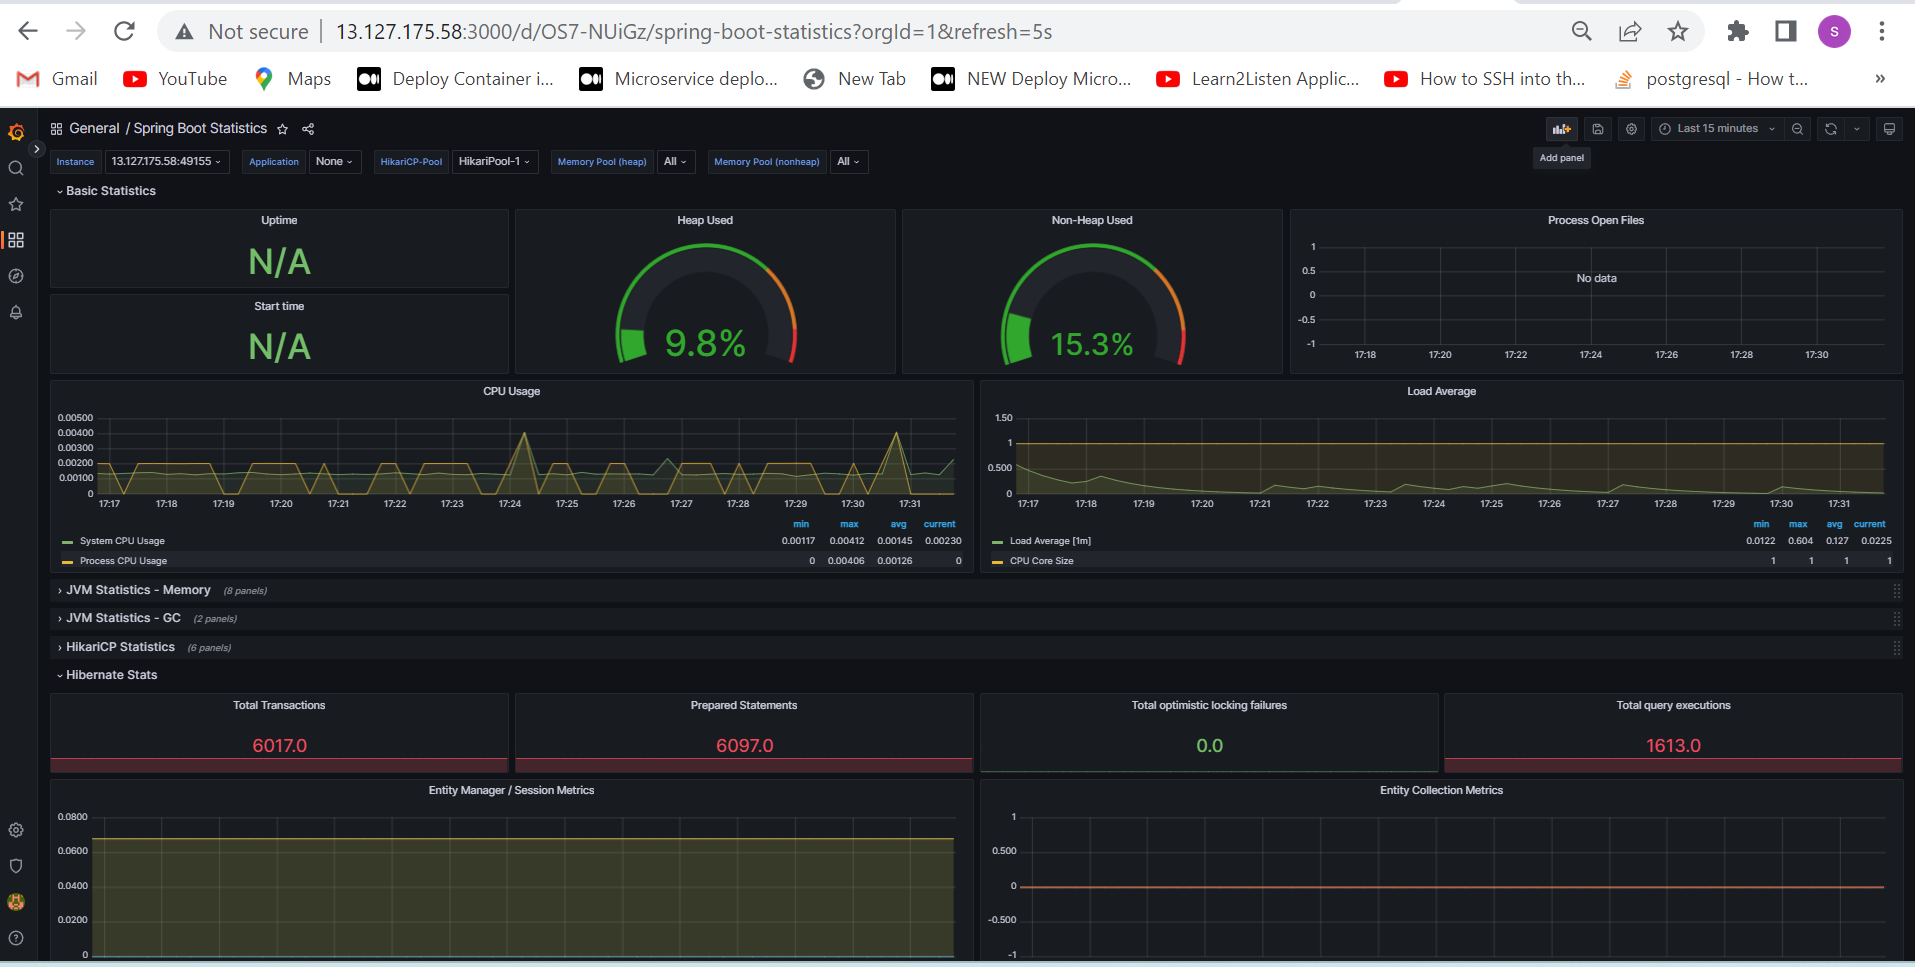
Figure 5. Grafana-UI
Alertmanager is installed to manage and route alerts generated by Prometheus, and to send notifications to appropriate recipients (mattermost) based on pre-defined rules.
12. Create alertmanager.yml file for sending alerts to mattermost.
global:
resolve_timeout: 5m
route:
group_by: ['alertname']
group_wait: 30s
group_interval: 5m
repeat_interval: 12h
receiver: 'mattermost'
receivers:
- name: 'mattermost'
slack_configs:
- api_url: 'https://kbconnect.cloud.mattermost.com/hooks/nnoq19pb8fbrzq9kaenkr6rzyc'
13. Create prometheus_rules.yml file, users can define a set of rules to monitor metrics collected by Prometheus. The rules can be used to evaluate the collected metrics and generate alerts when certain conditions are met.
groups:
- name: example
rules:
- alert: High404Errors
expr: count(http_server_requests_seconds_count{status="404"}) > 3
for: 5m
labels:
severity: warning
annotations:
summary: 'High number of 404 errors detected'
description: 'Number of 404 errors in the last 5 minutes is {{ $value }}'
14. Below command is used to run alertmanager with the rules and yml file configuration.
sudo docker run -d -p 9093:9093 -v /home/ec2-user/alertmanager.yml:/etc/alertmanager/alertmanager.yml prom/alertmanager
15. In the Security group of EC2 allow port:9093, where the prometheus is running.
Prometheus metrics will be visible on http://13.127.175.58:9093/
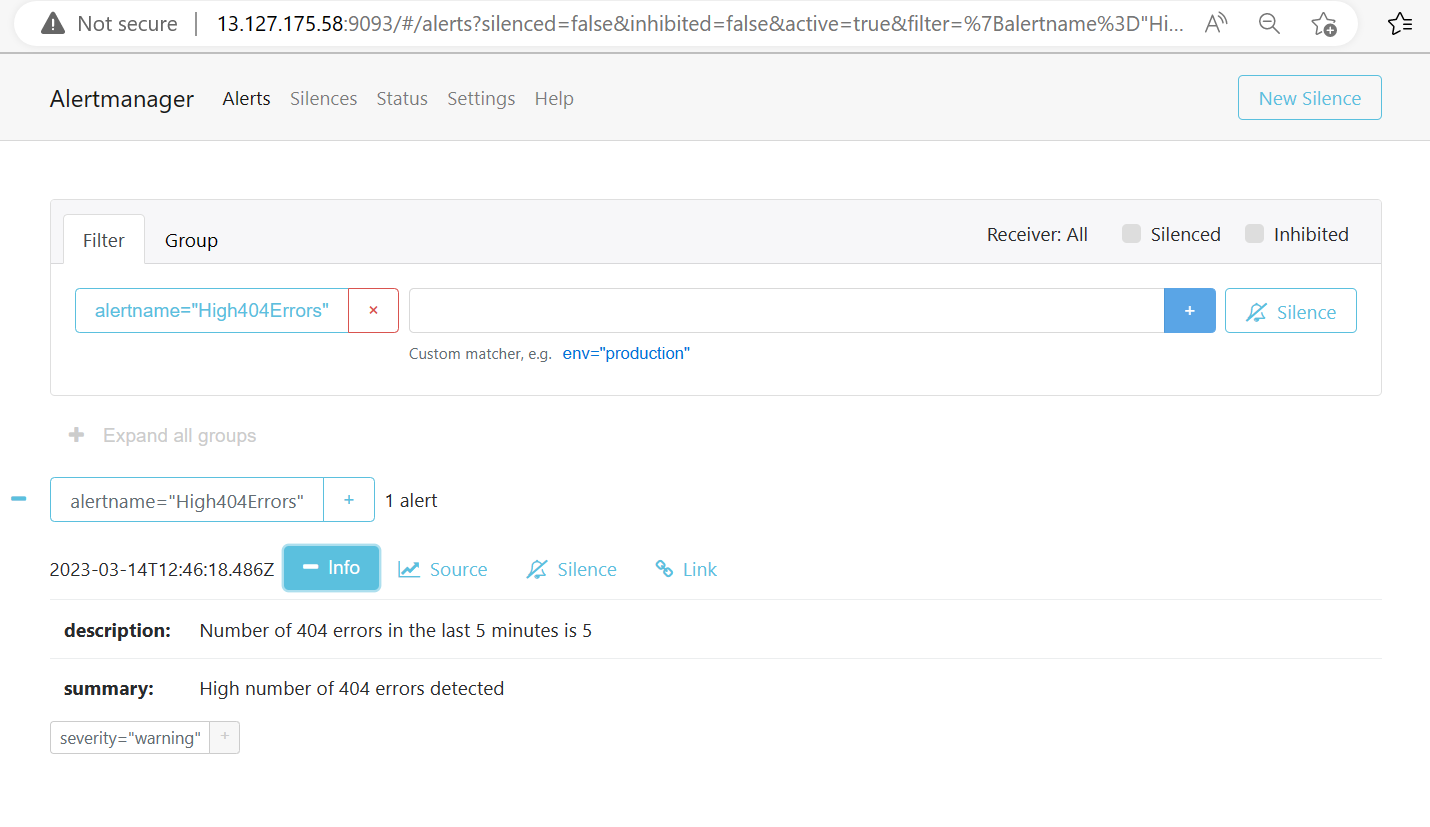
Figure 6. Alertmanager