AWS EKS Cluster Monitoring and Alerting Solution Using kube-prometheus-stack
Prerequisites
Below are the prerequisite needed for this implementation :-
-
AWS EKS cluster with kubernetes version 1.19+
-
Helm 3+ To Install Click here.
-
Kubectl installed and configured.
Step 1: Add Helm repository.
helm repo add prometheus-community https://prometheus-community.github.io/helm-chartsStep 4: Install the helm chart.
helm install `prometheus` prometheus-community/kube-prometheus-stack -n dev-monitoringHere prometheus is the release name, you can choose any name as per your naming convention.
Step 5: Enable istio-injection using kubectl command.
kubectl label namespace dev-monitoring istio-injection=enabled --overwriteStep 5: Use the below command to check all deployed objects.
kubectl get all -n dev-monitoringYou should see the deployed objects like below :-
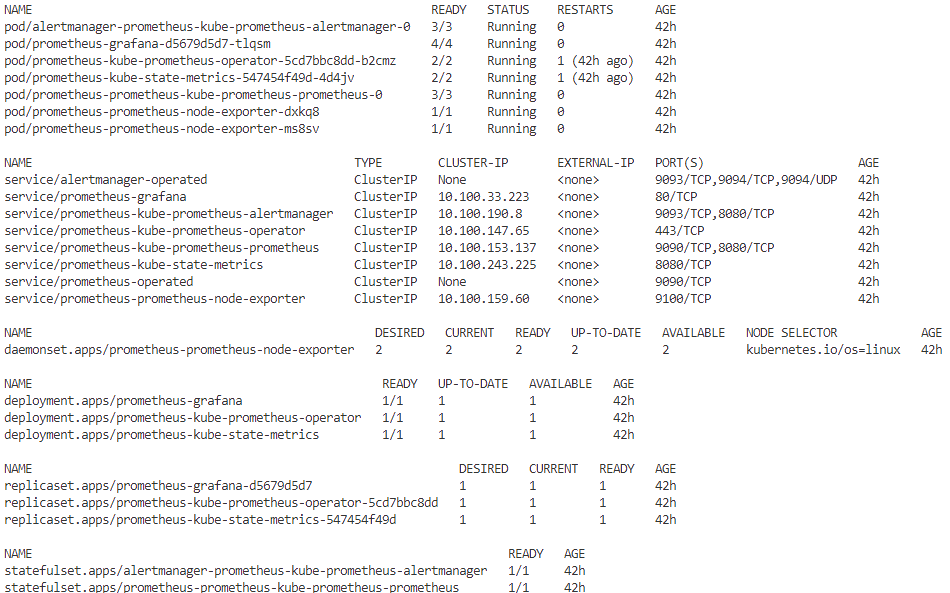
Step 6: Use the below port forwarding command to forward a local port to a port on the pod
kubectl port-forward service/prometheus-stack-kube-prom-prometheus 9090:9090 --address 0.0.0.0 -n dev-monitoring| If you are using an EC2 machine to access your EKS cluster, you need to open port 9090 in your security group as well. |
Step 8: Now we can access the Grafana UI the same way as well :-
kubectl port-forward service/prometheus-grafana 3000:80 --address 0.0.0.0 -n dev-monitoringThe default username and password to access the Grafana UI are
Username : admin
Password : prom-operator
| You can change the admin password in the helm chart values file |
Istio + prometheus + grafana ( Route Traffic )
If you’re using Istio to route traffic, you’ll need to create a Gateway and VirtualService. Additionally, you’ll need to add DNS records to Route 53 to access Prometheus and Grafana.
-
Gateway
dev-monitoring namesapce to connect services using Virtualservices
apiVersion: networking.istio.io/v1alpha3
kind: Gateway
metadata:
  name: monitoring-gateway
  namespace: dev-monitoring
spec:
  selector:
    istio: ingressgateway # need to match with istio ingress label
  servers:
    - port:
        number: 80
        name: http
        protocol: HTTP
      # tls:
      #   mode: SIMPLE
      #   credentialName: "tls-secret"
      hosts:
- "*"-
VirtualService
Virtual service to connect grafana-servcies based on port numaber and Host Header
apiVersion: networking.istio.io/v1alpha3
kind: VirtualService
metadata:
name: grafana-servcies
namespace: dev-monitoring
spec:
hosts:
- "logs.mercotrace.com" # This will match any host header
gateways:
- monitoring-gateway
http:
- match:
- uri:
prefix: /
route:
- destination:
host: prometheus-grafana # services name with in the same namespace (kubectl get svc -n dev-monitoring)
port:
number: 80
After once upadte DNS name in Route53 you will get prometheus and grafan login page show in below.
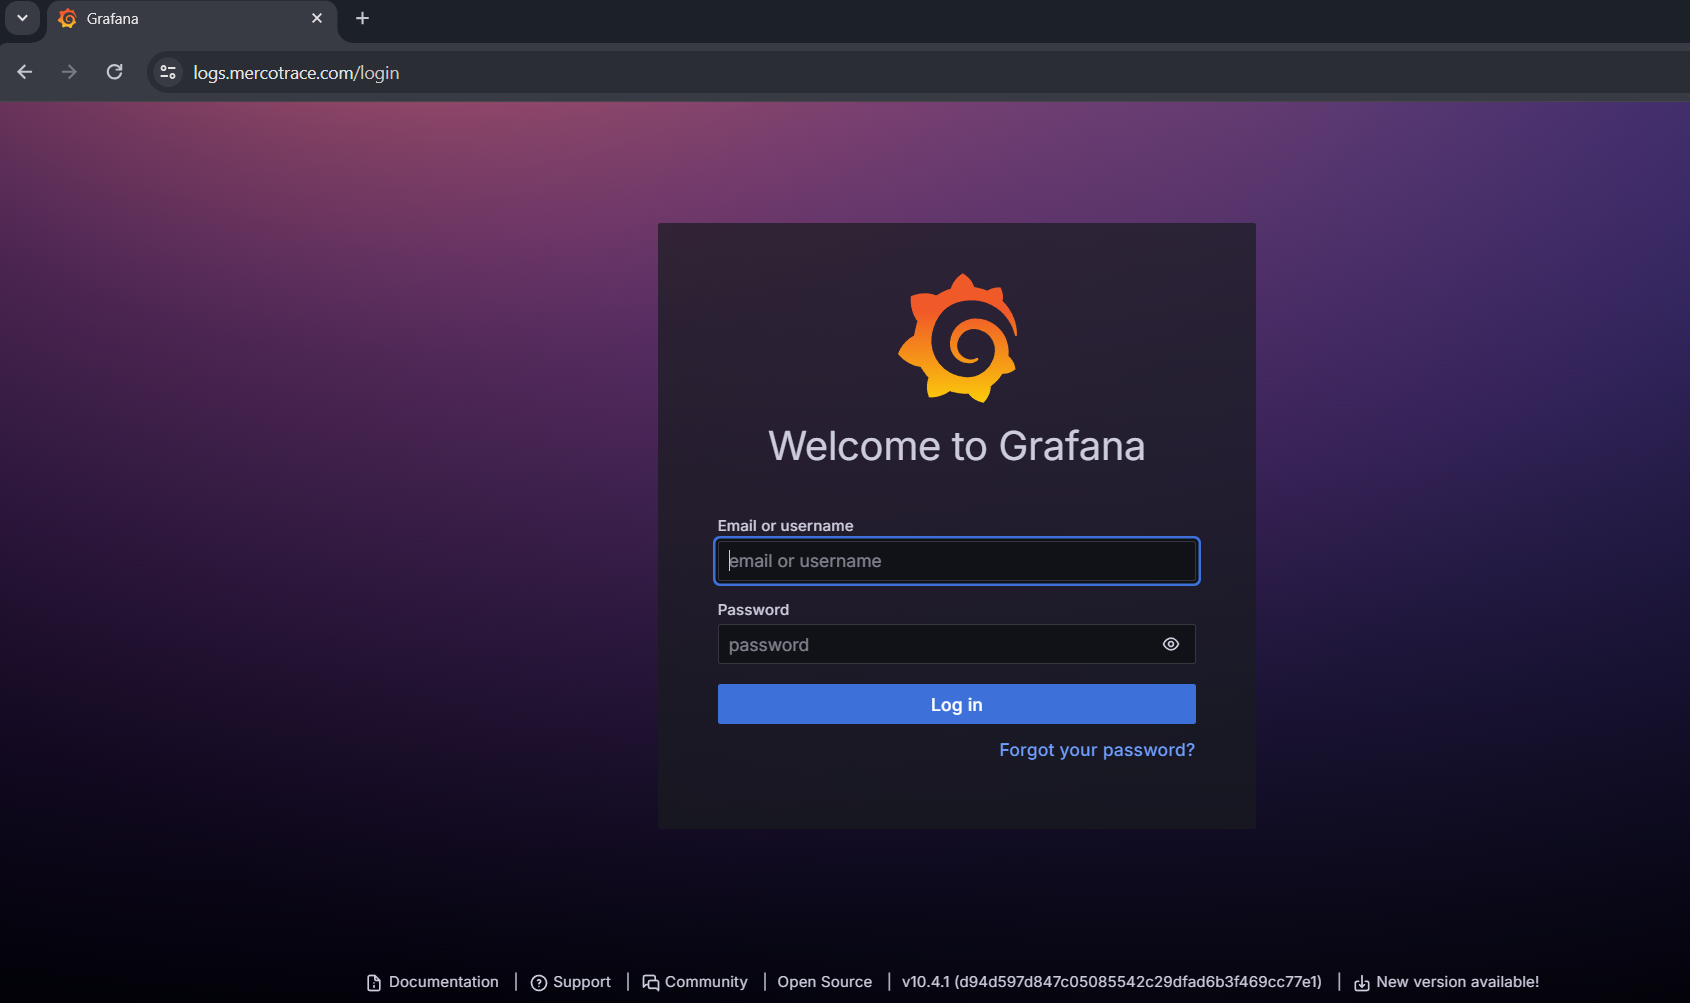
Prometheus Operator configuration
-
The custom resources managed by the Prometheus Operator are:
-
Prometheus
-
ThanosRuler
-
ServiceMonitor
-
PodMonitor
-
Probe
-
PrometheusRule
-
AlertmanagerConfig
-
PrometheusAgen
-
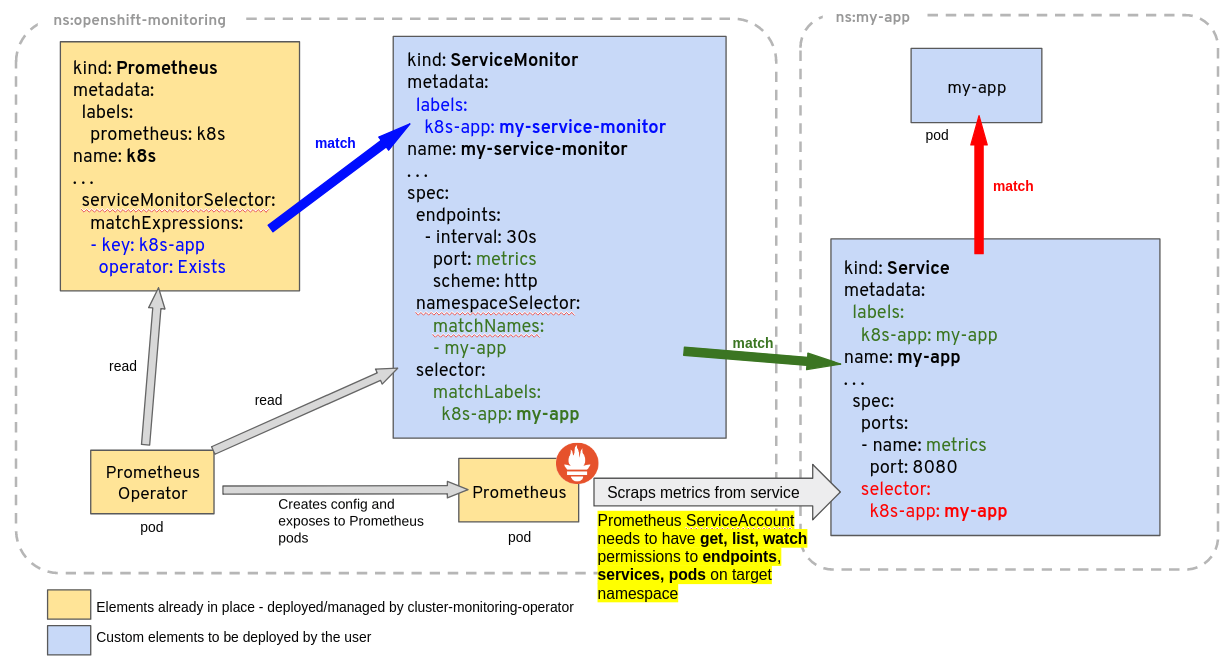
Prometheus : The Prometheus custom resource definition (CRD) declaratively defines a desired Prometheus setup to run in a Kubernetes cluster.
kube-prometheus-stack has been installed. Check its status by running:
kubectl --namespace dev-monitoring get pods -l "release=prometheus"ServiceMonitor: The ServiceMonitor custom resource definition (CRD) allows to declaratively define how a dynamic set of services should be monitored. Which services are selected to be monitored with the desired configuration is defined using label selections.
apiVersion: monitoring.coreos.com/v1
kind: ServiceMonitor
metadata:
  name: dev-<APPNAME>-metrics
  namespace: dev-monitoring # Change this to the namespace the Prometheus instance is running
  labels:
    release: prometheus # This should match with labels `prometheus` running on kube-prometheus-stack namesapce
spec:
  endpoints:
  - interval: 5s
    port: http-svc
    scheme: http
    path: /actuator/prometheus # servicesmetric scrap path
  namespaceSelector:
    matchNames:
    - develop
  selector:
    matchExpressions:
      - key: app.kubernetes.io/name
        operator: Exists
apiVersion: v1
kind: Service
metadata:
name: service-svc # Name your service accordingly
namespace: develop
labels:
app.kubernetes.io/name: my-custom-service
annotations:
prometheus.io/scrape: "true"
prometheus.io/scheme: "http"
prometheus.io/path: "/actuator/prometheus"
prometheus.io/port: "3030"
spec:
type: ClusterIP # Set the service type to NodePort
ports:
- port: 80
targetPort: 8900 # Port your application is listening on
protocol: TCP
name: http-svc
selector:
app.kubernetes.io/name: my-custom-service| If Istio has RequestAuthentication and AuthorizationPolicy enabled for those microservices, you need to allow Prometheus to scrape metrics without token validation. |
Istio - AuthorizationPoliy
  rules:
    - to:
        - operation:
            paths: ["/actuator/prometheus"]
Check this Repo to get helm charts.
For more details, refer to the kube-prometheus-stack documentation.